Foreword
This might just be you. (Rant incoming.)

Wait, don’t leave yet! After wading through all that material in the previous articles, are you as sick of the red tape as Godfrey, the First Elden Lord, was? I won’t go so far as to encourage you to strip down and renounce your throne like he did as Hoarah Loux — but we can walk through a few real cases with Grafana and Prometheus. Seeing it in screenshots and walkthroughs will make the usage a lot clearer. The rest of this article will include several example images.
Observing Under Load Testing
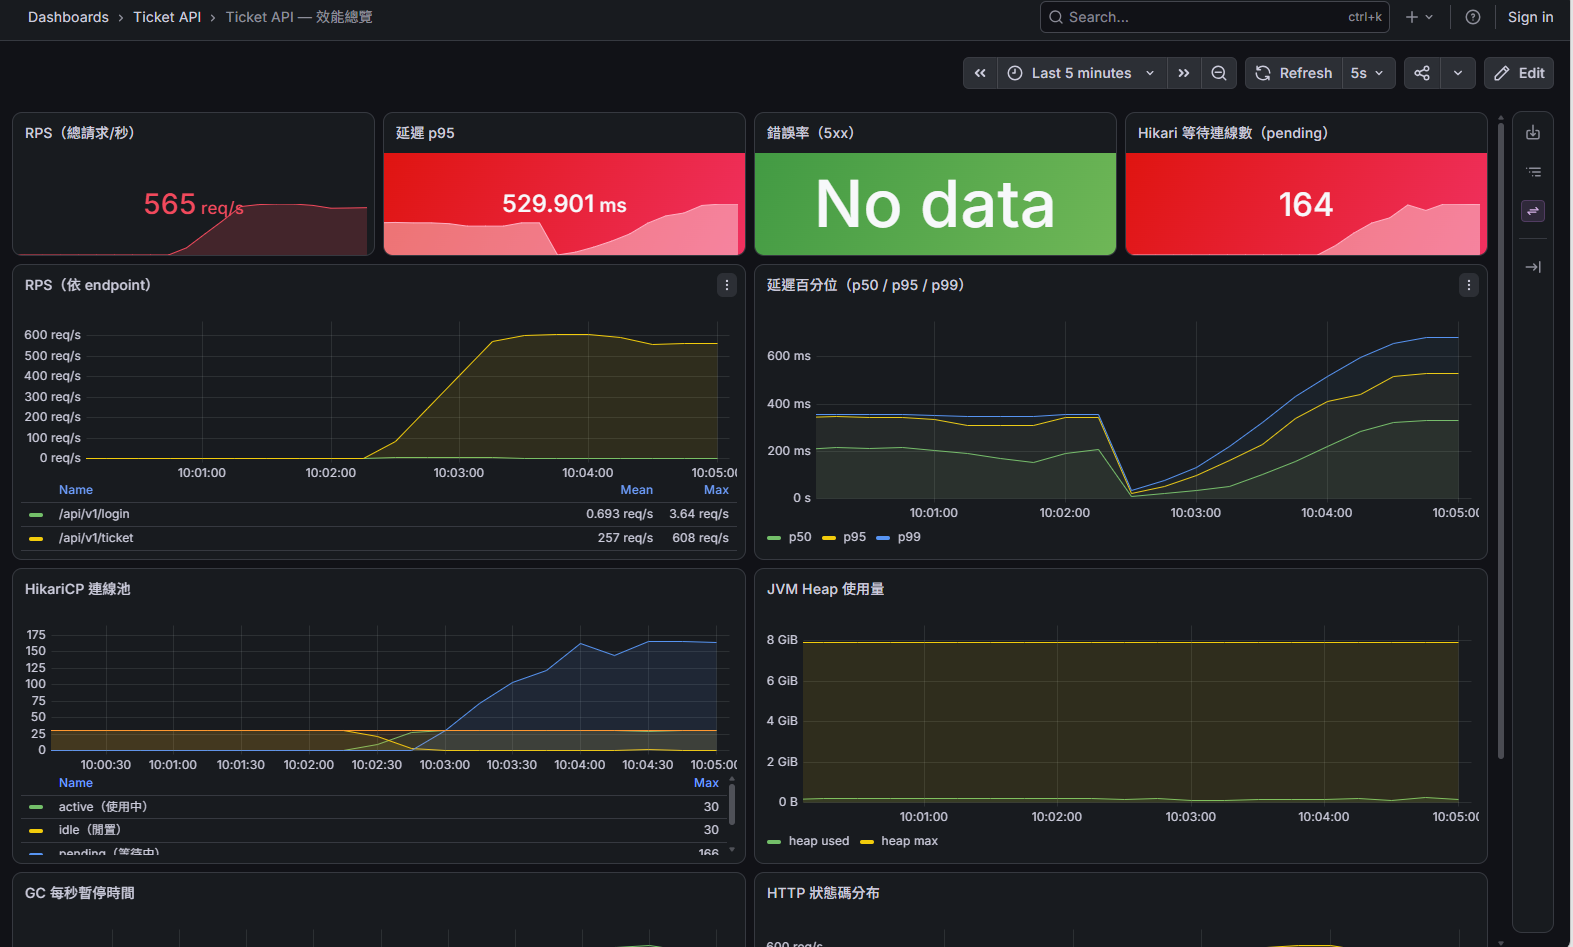
A typical Grafana dashboard looks like this — through visualized charts we can see the system’s current metric values. As an example, this screenshot is the result of a load test I ran locally. In the top-left, you can see the system’s current RPS, latency status, database connection pool status, and so on. In the bottom-left chart in particular, you can clearly see that as load climbs, active connections rise and cross paths with idle connections, signaling that pressure is building. Then, once active connections hit max_connections, pending connections slowly start to climb, eventually overshooting max_connections by several times over — a clear sign that the database connection pool has run out of room. The HikariCP wait count in the top-right confirms this too.
On top of that, the Java Heap usage on the right didn’t change much, which tells us GC isn’t much of a factor in this bottleneck. From here we can dig further — is a @Transaction holding on too long, is an oversized query the culprit, and so on. Having Grafana in place saves us plenty of wrong turns along the road to performance tuning.
Querying a Single API’s P95 Latency
Say you want to know the P95 latency of /api/v1/ticket (95% of requests come in under this latency). In Grafana, you’d write a PromQL query like this:
histogram_quantile(0.95, sum by (le) (rate(
  http_server_requests_seconds_bucket{uri="/api/v1/ticket"}[5m])))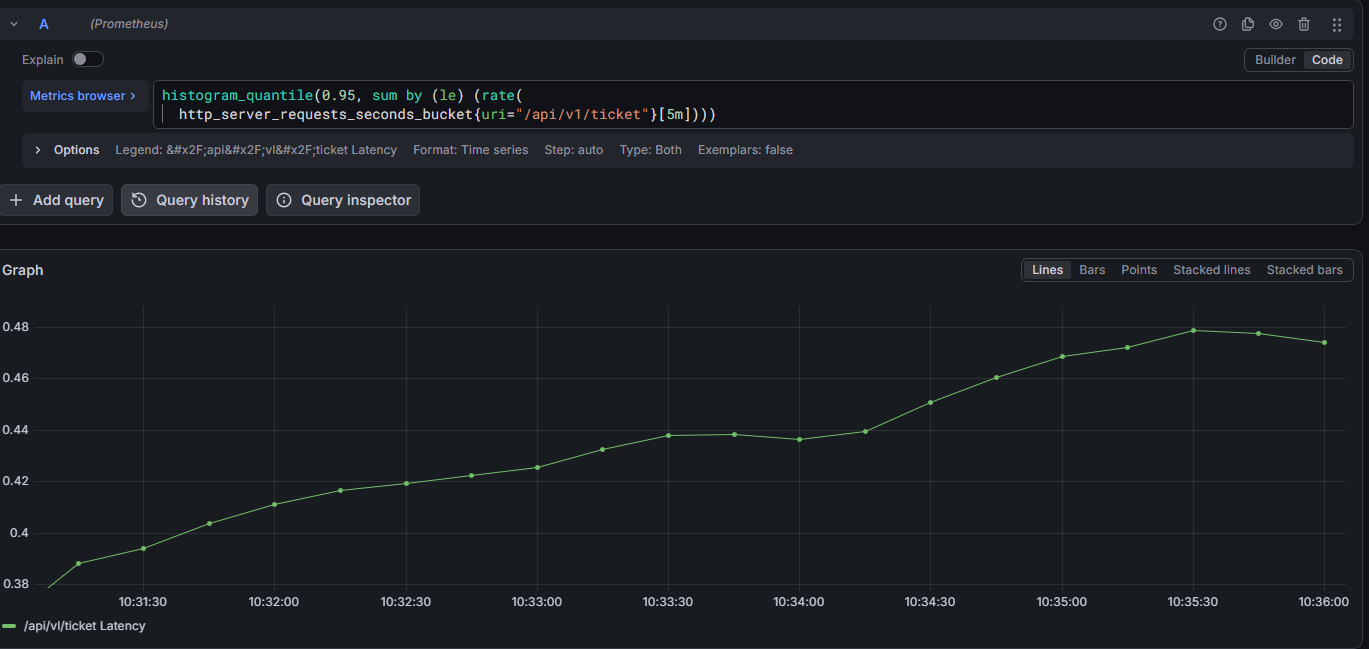
Under load testing, this API’s latency kept climbing, eventually reaching 480ms. That means 5% of users would experience a latency of 480ms or worse. That may not sound too bad on its own — but the point here isn’t the number, it’s the measurement method. What matters more than the number itself is the trend. If you see P95 latency climbing steadily over a short period (rather than a single spike), it usually means some resource is being overwhelmed — maybe the connection pool is maxed out, a cache invalidation is sending all requests to the DB, or the JVM has slipped into frequent GC. Pulling up a few more lines for cross-reference at this point will help you actually locate the bottleneck instead of guessing.
Generally speaking, here’s a rough benchmark for judging API latency by P95:
| P95 Latency | Verdict |
|---|---|
| < 100ms | Good |
| 100–300ms | Average, room for optimization |
| > 500ms | Slow, needs investigation |
If all you want is a single API’s latency, you’ve already got it. But suppose we want to go further — what if a single API involves multiple moving parts: it calls an internal service, reads a file, and hits an external service all at once? Once you know the API is slow, do you actually know which part is slow? Are you going to drop a log statement at every step and test one by one? How many log lines would that take, and might you end up generating a mountain of useless data in the process?
So, if possible, we need a more detailed way to analyze this. And that’s exactly where Grafana + Prometheus has your back.
Timing a Specific Block of Code
To time a specific block of code, there’s no way around writing a bit of code. First, we need to inject the MeterRegistry bean into the block we want to monitor. A rough example looks like this:
class A {
  public void someMethods() {
   // Inject MeterRegistry

    Timer.Sample coreSample = Timer.start(meterRegistry);
    /////////// Some time-consuming operation
    coreSample.stop(meterRegistry.timer("ticket.purchase.core"));

  }
}
Once that’s in place, the elapsed time gets recorded, and in Prometheus you can look up this API’s timing using the tag "ticket.purchase.core". But that’s not quite enough — remember, our API’s latency was queried at P95. To keep things consistent, we need one more piece of configuration to make it support histogram_quantile():
management:
  metrics:
    distribution:
      percentiles-histogram:
        "[http.server.requests]": true
        "[ticket.purchase.core]": true
      percentiles:
        "[http.server.requests]": [0.5, 0.95, 0.99]
        "[ticket.purchase.core]": [0.5, 0.95, 0.99]
Once that’s configured, we can query the processing time of this specific code block with this PromQL:
histogram_quantile(0.95, sum by (le) (rate(
  ticket_purchase_core_seconds_bucket[5m])))
One small thing worth flagging here: in the code, we named it ticket.purchase.core (dot-separated), but by the time it reaches the PromQL query, it becomes ticket_purchase_core_seconds_bucket (underscore-separated, with an added _seconds_bucket suffix). That’s not a typo — it’s a naming convention conversion that Micrometer applies when handing data off to Prometheus. Prometheus metric names can’t contain dots, so Micrometer automatically converts dots to underscores, and then appends suffixes like _seconds and _bucket based on the metric’s unit (seconds, here) and whether it’s a histogram. If you try querying with the raw name straight from the code, you’ll come up empty — you need to convert it to the actual naming format on the Prometheus side.
Here’s the result:
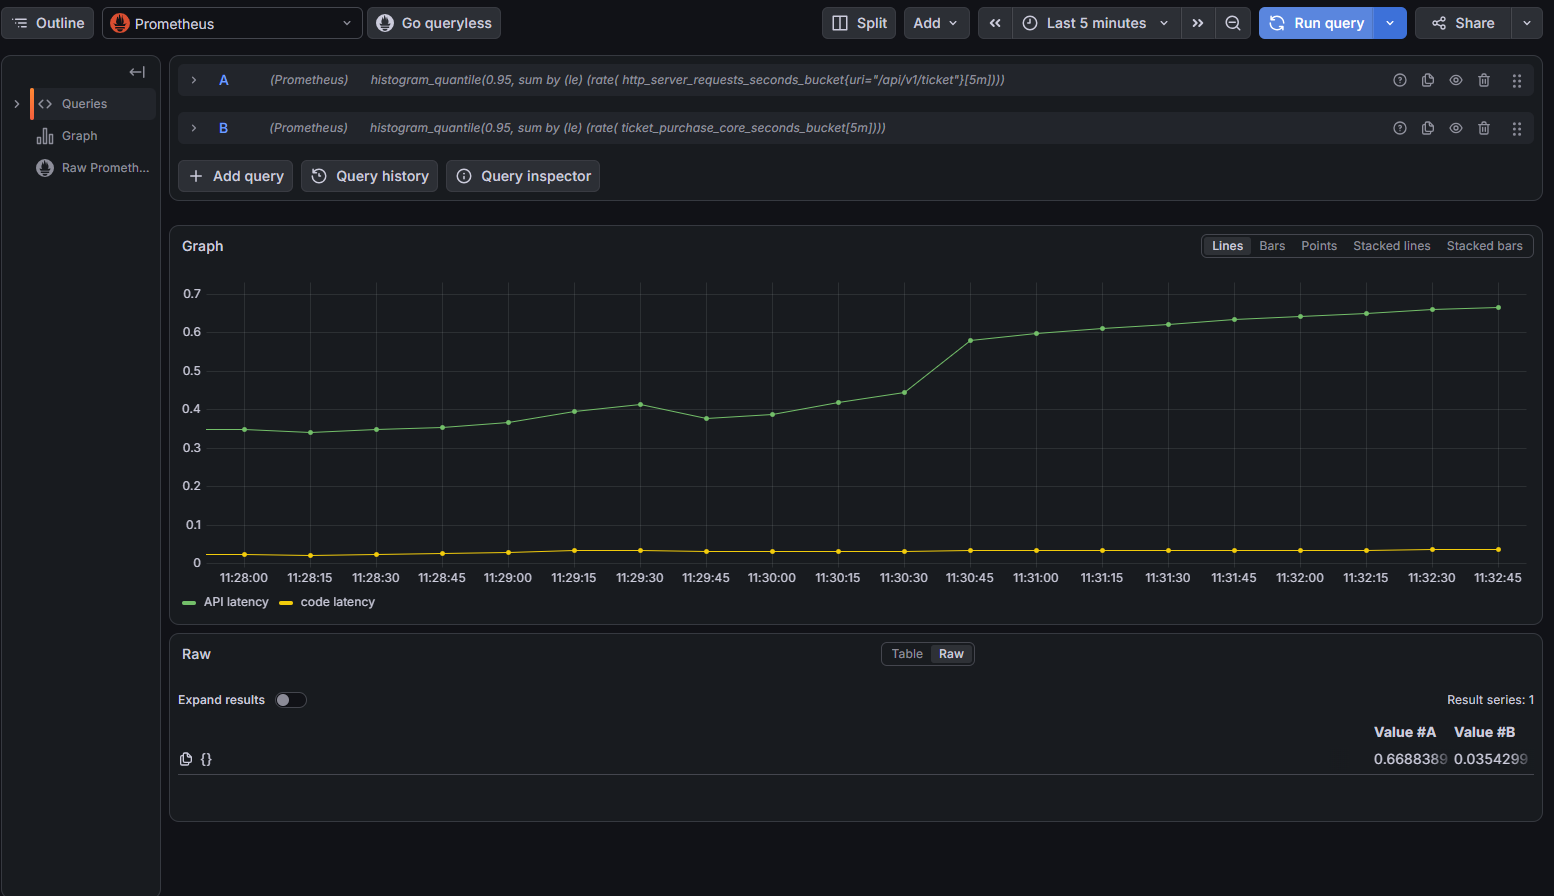
The experiment’s result isn’t exactly stellar this time, but that’s fine — this is just an example. Going forward, this same approach can be used to integrate Prometheus for analyzing the timing of any given block of code, giving us a lot more confidence when doing that kind of evaluation.